Microsoft Sentinel Lab Setup
Building, deploying, and testing a SIEM using Microsoft Sentinel

This is a writeup of the process I went through to build, deploy, and test a Security Information and Event Management (SIEM) system using Microsoft Sentinel. This is a great way to get practical experience with a cloud-based SIEM and learn how to monitor and respond to security incidents in a cloud environment.
Objectives: Create a Windows 11 VM, deploy Microsoft Sentinel, and test the SIEM by generating alerts
Introduction: What is a SIEM?
What is a SIEM? A Security Information and Event Management (SIEM) system is a centralized platform that collects, aggregates, and analyzes security data from various sources across an organization’s network. SIEM systems provide real-time monitoring, alerting, and reporting capabilities to help organizations detect and respond to security incidents. As a security analyst or incident responder, having experience with SIEM systems is crucial for effectively monitoring and defending an organization’s network.
Lab Setup
Step 1: Create a Windows 11 VM
The first step in setting up our SIEM lab is to create a Windows 11 virtual machine (VM) in Microsoft Azure. We will use this VM to allow RDP connections and create rules to generate security alerts in Microsoft Sentinel.
Below shows the settings used to create a Windows 11 VM, we will use default settings for most configurations and place the VM in a new resource group called Project1VM_Group.
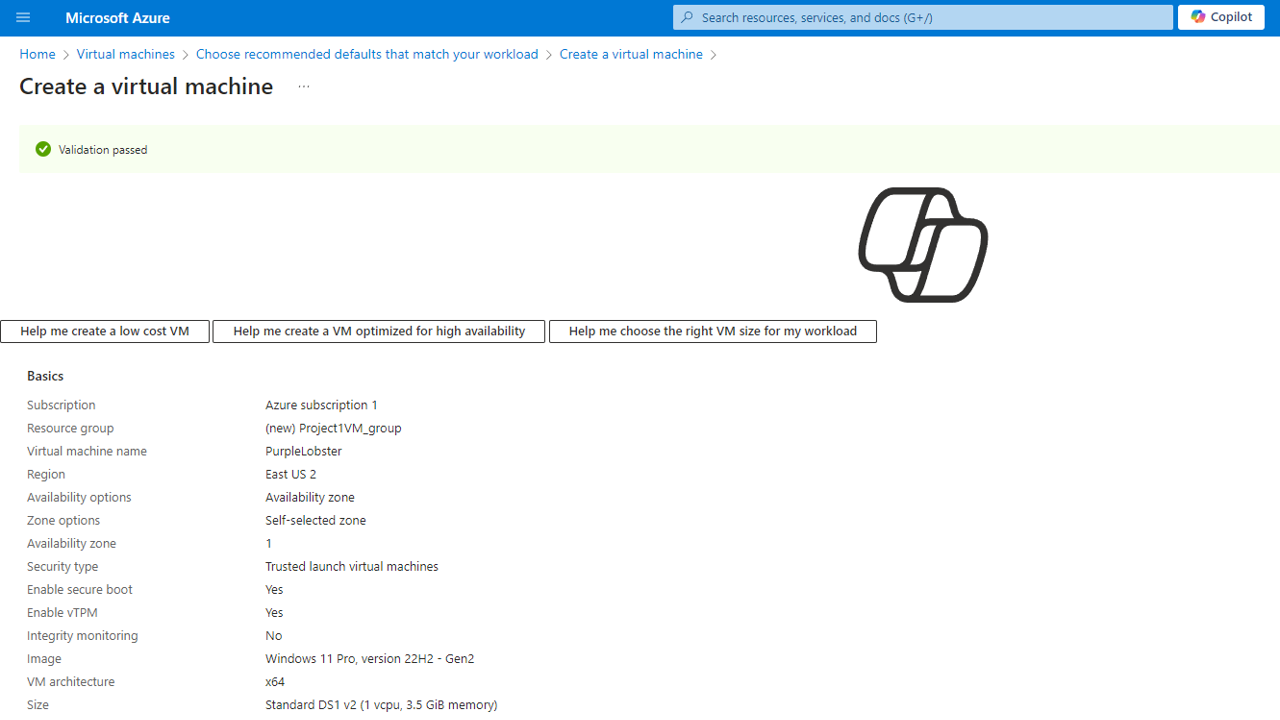
While the VM is deploying, we will move on to the next step.
Step 2: Creating the Log Analytics Workspace
The next step is to create a Log Analytics workspace in Azure. This workspace will be used to store and analyze the security logs generated by our Windows 11 VM. We have to configure the event logs of the VM to be sent to this workspace, and then to Sentinel. Below, we create a new Log Analytics workspace and use the same resource group as the VM.
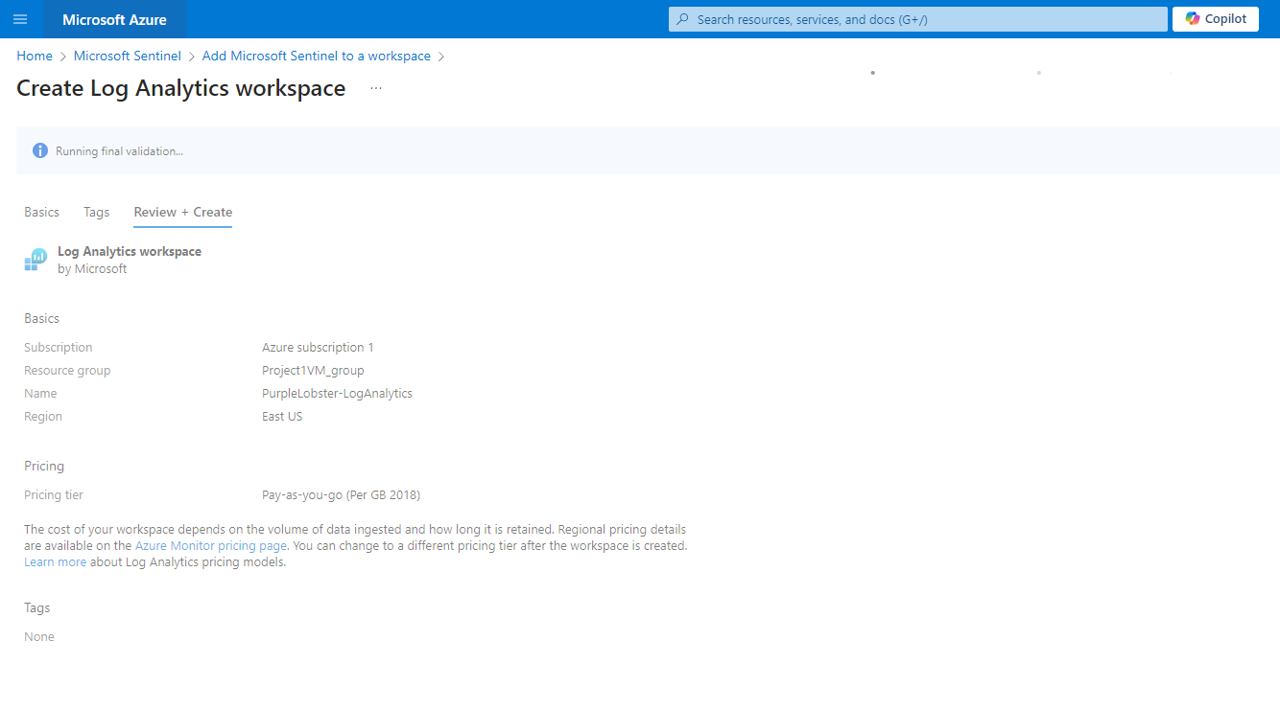
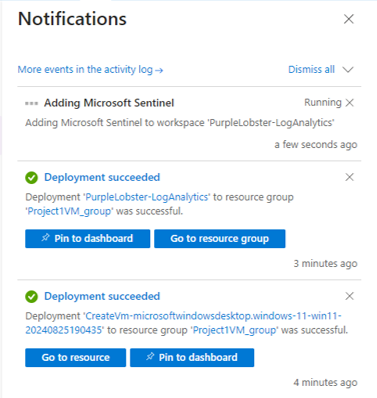
Now, we will wait for both the VM and the Log Analytics workspace to be deployed.
Step 3: Installing a Data Connector
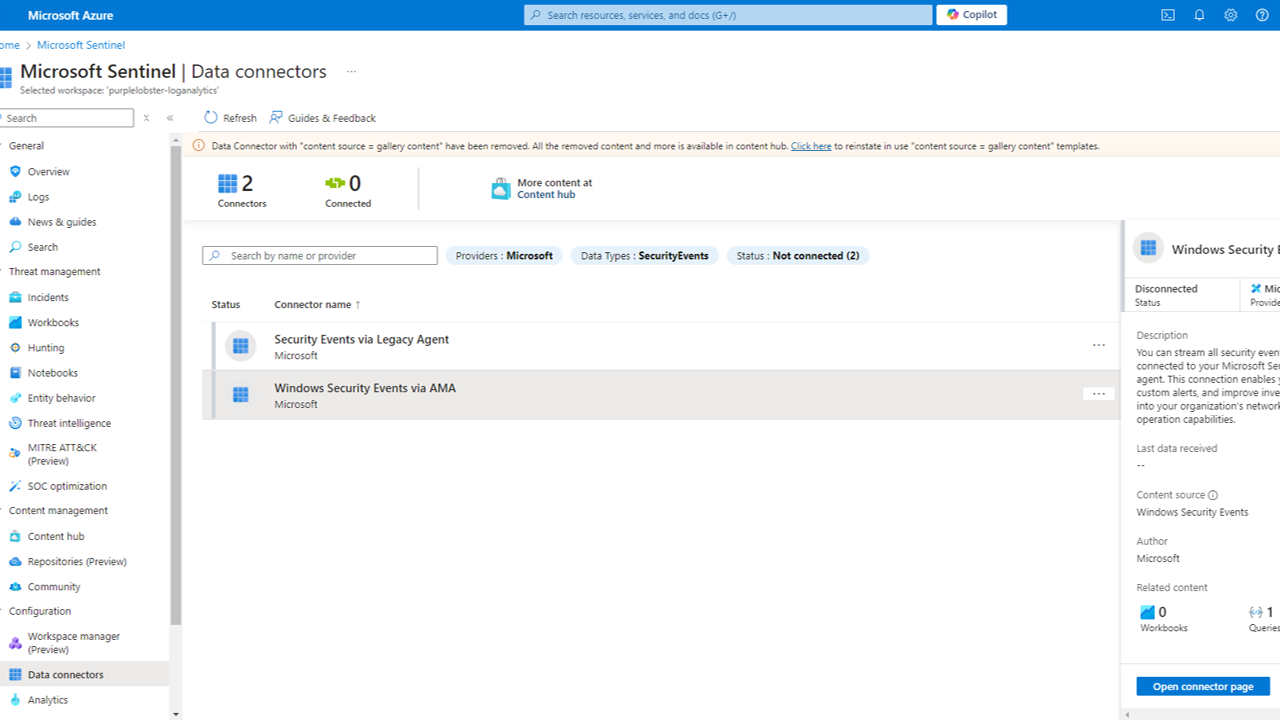
Once the VM and Log Analytics workspace are deployed, we need to install a data connector to send security logs to the Log Analytics workspace. A data connector is a configuration that allows data to flow from a data source to a destination, in this case, from the Windows 11 VM to the Log Analytics workspace, allowing Sentinel to analyze the data. We will use the Windows Security Events data connector to collect security events.
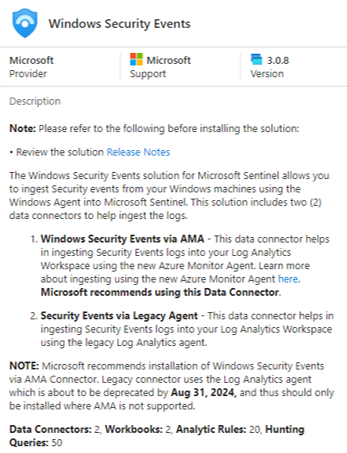
This options comes with 2 data connectors by default, the one of interest for us is Windows Security Events via Azure Monitor Agent (AMA).
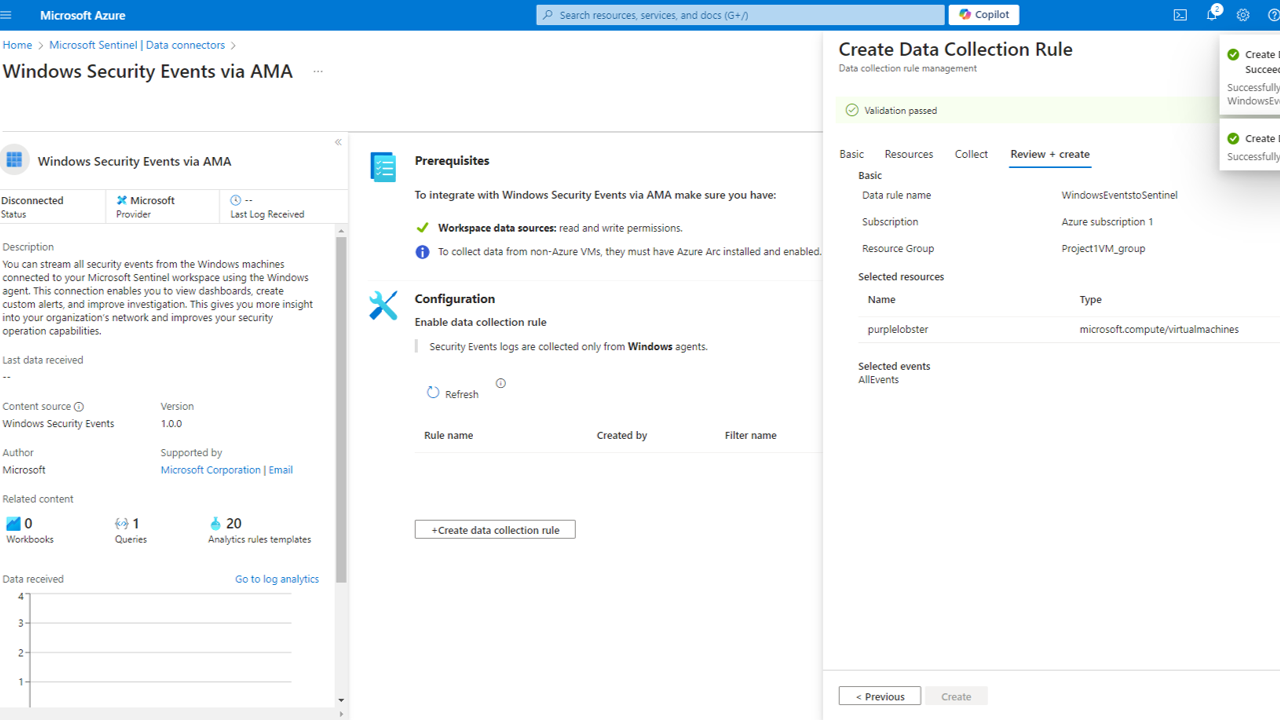
Step 4: Configuring the Data Connector
Next, we will create the data collection rule for the Windows Security Events data connector. This rule specifies which events to collect and how to send them to the Log Analytics workspace. We will configure the rule to collect all security events from the Windows Security log and send them to the Log Analytics workspace.
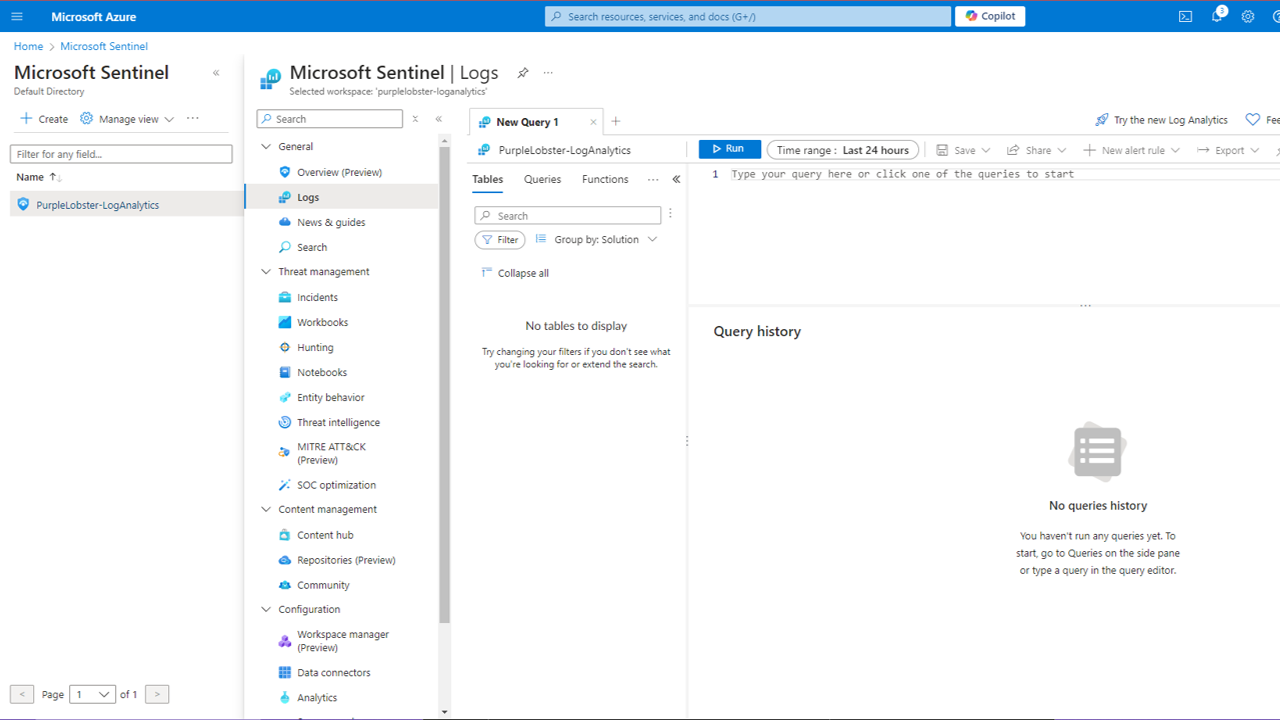
Now, we can go to the Logs sections of Sentinel. Here we can create rules, or query the logs for specific events. This can be more useful in a larger environment where more events will be triggered, but for the purposes of this lab, we will only see a few events and sorting them won’t be necessary.
Step 5: Creating an Alert Rule
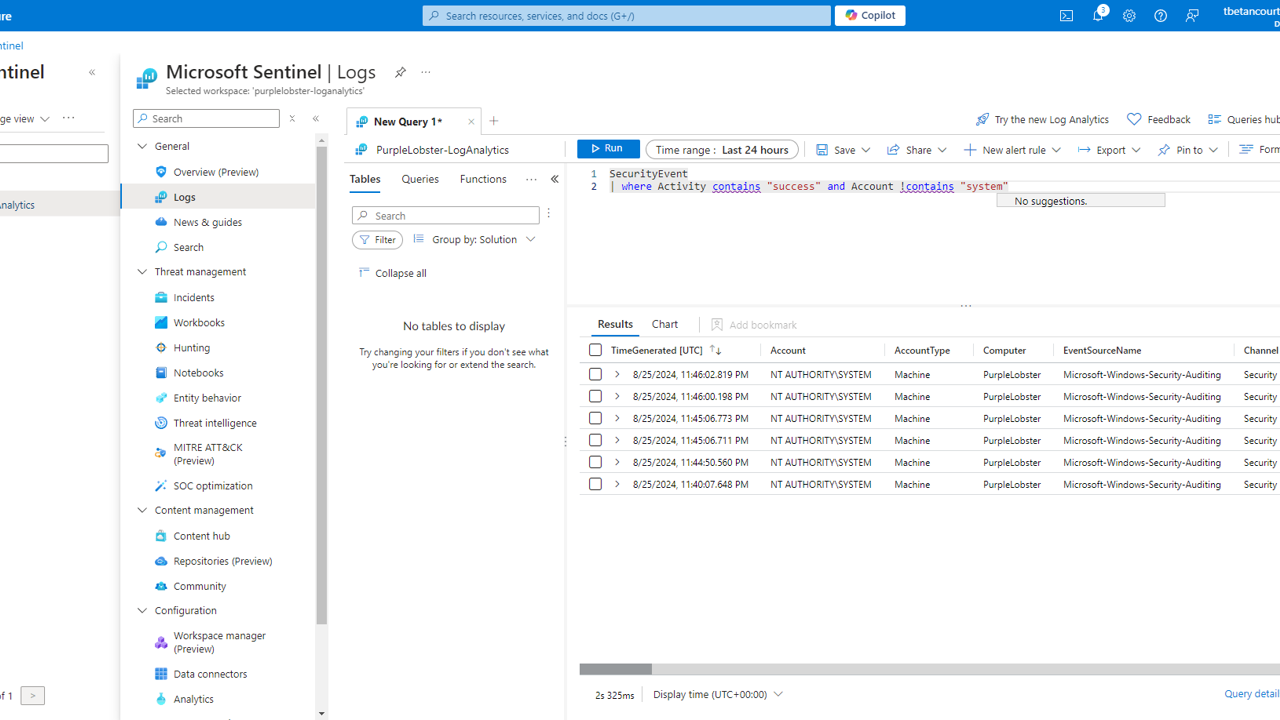
We will create a simple alert rule in Sentinel to generate an alert when a specific event occurs. The rule we want to make is for successful RDP connections to our Windows 11 VM. We will accomplish this with the following query:
1
2
SecurityEvent
| where Activity contains "SUCCESS" and Account !contains "SYSTEM"
This query will look for successful logins that are not system accounts. This is accomplished using
!contains "SYSTEM"to filter out system accounts.
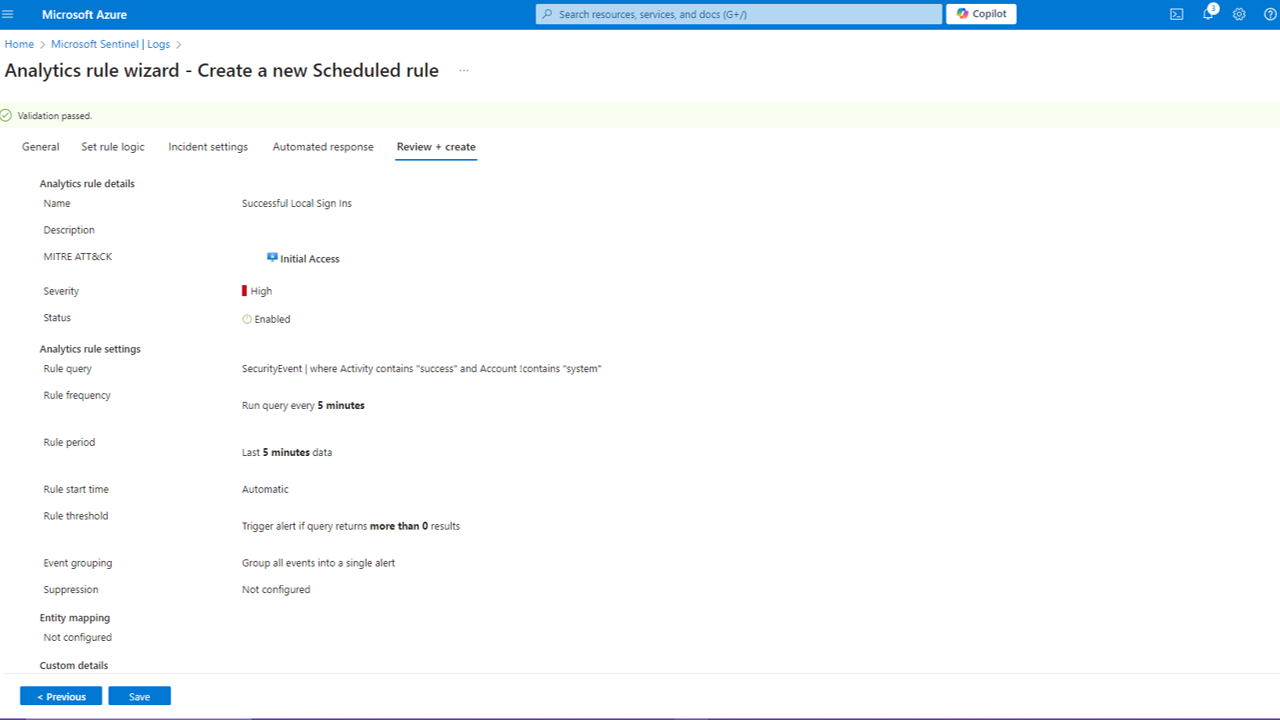
Below is an overview of the new rule we created. This will alert us of a high severity event when a successful RDP connection is made to the Windows 11 VM, and the query will be run every 5 minutes.
Testing the Rule
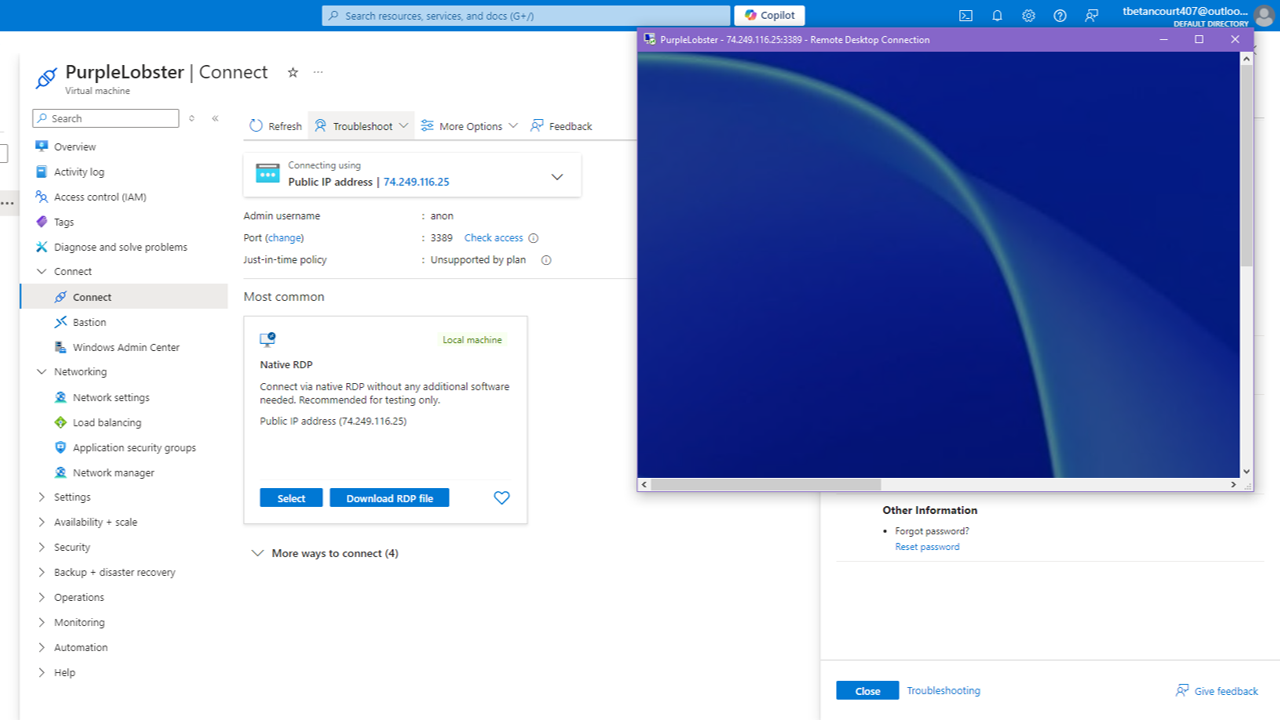
In order to test our new rule, we will need to login to the Windows 11 VM using RDP. We will use the public IP address of the VM and the username and password we set up during the VM creation process. This should generate a high severity alert in Sentinel.
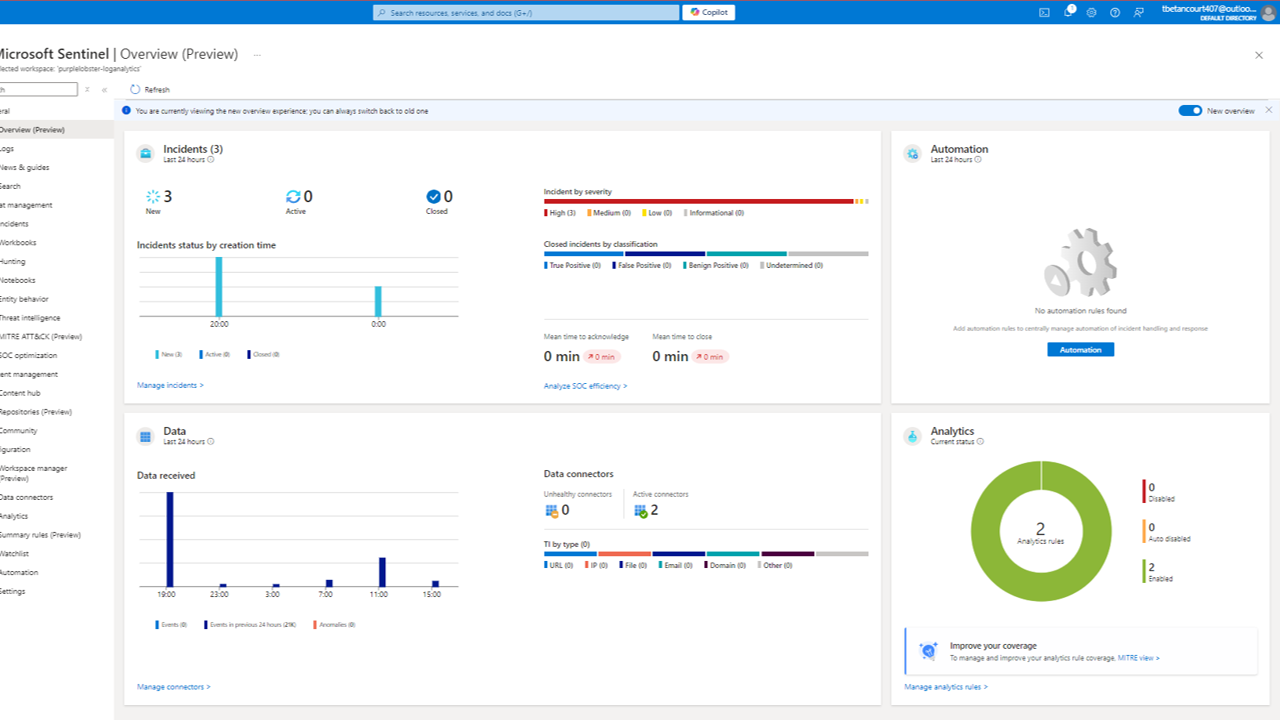
Switching back to Sentinel, we can see our dashboard with options such as Incidents, Analytics, Automation, and more. We can even see geo-location data of the IP addresses that have connected to our VM.
We can see some data already populated in the dashboard, and we can see a few Incidents have already occured.
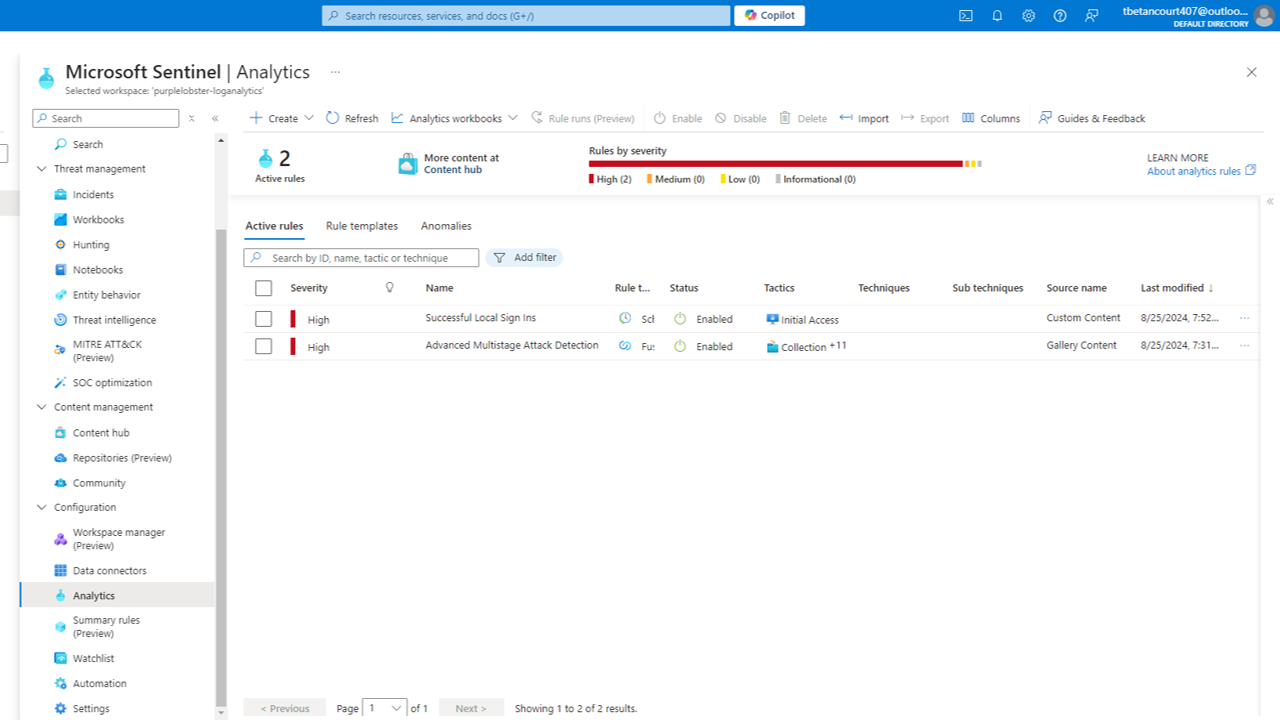
And we are successful. After signing in, we can see an alert generated with a high severity. We can see the timestamp, MITRE tactic, and name of the alert. We have successfully implemented our SIEM for our cloud environment. In a real world environment, this would be a crucial step in monitoring and responding to security incidents. We could then investigate the incident further, and take appropriate actions such as blocking the IP address or user account.
Conclusion
In this lab, we have successfully set up a SIEM using Microsoft Sentinel in Azure. We created a Windows 11 VM, configured a Log Analytics workspace, installed a data connector, and created an alert rule to generate alerts for successful RDP connections. This lab provides hands-on experience with setting up and testing a SIEM system in a cloud environment, which is essential for security analysts and incident responders.